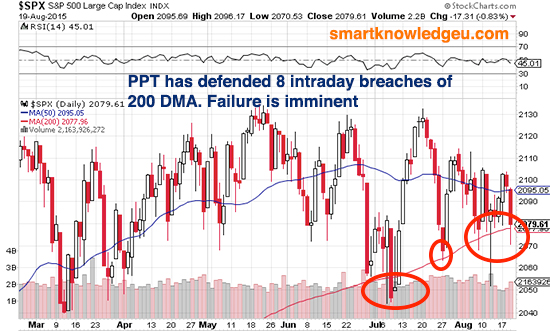
The PPT (Plunge Protection Team) has been throwing its weight in the US stock markets with incessant futures buying, likely individual stock buying to ramp up the S&P500 index everytime it has broken key technical support line in intraday trading, and with even a blatant shutdown of all trading on the NYSE on 20 July 2015 for good measure. This is done all for the purposes of selling the MSM narrative that “everything is awesome” in the US economy and to support their Wall Street banker bed mates even as the average American is barely scraping by in a US economy that has really been in recession for quite some time now. In the below chart, we see that every single time the US S&P500 broke down below its 200DMA (eight times in all in just the last six weeks!) in intraday trading, the PPT rescued the market to ensure that by market close, the S&P500 was above its 200DMA. But you can only stretch a rubberband so many times before it snaps. At maalamalama we’d say that the S&P500 is getting ready to break at some point over the next several weeks.
